Image Files Overview
Aim
The purpose of this article is to explain the image overview of the RAYLYTIC Platform.
Explanations
Image Files
An overview of all images in RAYLYTIC can be find in the menu section “Study Overview” / subsection “Image Files” (Figure 1).

This overview is displayed in the format of a table. The first row of the table displays the image types (e.g. spine lateral or AP image, hip-AP image, etc.) for a specific time point (e.g. 6 months, 12 months) that are required for the selected study.
Image status
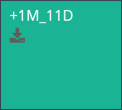
Each cell in the table is colored according to its status. The meaning of each color and the information contained in each cell according to the status is described below:
Green cells: The image successfully passed the quality check and is available for radiographic analysis.
It is also shown how many “years_months_days” after ("+") or before ("-") the surgery the image was taken.Turquoise cells “Not in Time”: The image successfully passed quality check and is available for radiographic analysis. However, the image was taken outside the allowed time window specified in the study design.
Light red cells “missing” : The image is currently missing, once the follow-up period has already ended and no image was uploaded. If the image was taken and not yet uploaded, it can still be uploaded to the RAYLYTIC Platform via the menu section “Upload & Import” “[Upload and Measure Image](https://help.raylytic.com/medical-image-transfer-and-analysis/uploading-several-images-also-for-multiple-patients-using-the-batch-mode/ )”. If the imaging was certainly not performed, the status of the specifc image can be modified from “missing” to “not taken” via the small pencil icon next to “missing”. A pop-up window will appear and the status can be changed from the drop-down list under “DICOM Status”. Here, entering a comment is mandatory.
Red cells “not taken”: No image was uploaded and it was confirmed that the image was not taken.
Orange cells: These cells show a currently open time frame, in which imaging can be performed for the patient. In order to facilitate the visualization and planning, the end date of this time frame (as well as remaining years, months and/or days until this end date) are displayed in each cell.
White cells: These cells show upcoming follow-up periods for each patient and time frame. These cells will automatically turn orange when the follow-up period starts and turn red (“missing”) if the follow-up period ends and no image was uploaded.
Blue cells: These cells show patients with the status “Excluded” from the study. Images can no longer be uploaded for these patients


Legend
Below the table, a legend provides the user with some extra explanation.
Remarks on image quality are coded as follows:
C = Clarity not usable: An image marked with this letter cannot be used for further measurements/assessments or the accuracy is reduced due to significant image noise.
P = Significantly out-of-plane: An image marked with this letter cannot be used for further measurements/assessments or the accuracy is reduced due to a significant out of plane of relevant anatomical structures.
Q = Quality not usable: An image marked with this letter cannot be used for further measurements/assessments or the accuracy is reduced due to inferior overall image quality.
V = Visibility not complete: An image marked with this letter cannot entirely or partially be used for measurements/assessments due to missing anatomical structures in the image.
Examination Period Windows: The examination periods are clearly described. For each study follow-up, a time period tolerance can be configured in the study design (for example as recommended by FDA). Besides that, alternative larger periods can be configured in order to include or display a larger number of images in the study. This alternative tolerance is also responsible for cells with the status “Not in Time” colored in turquoise as described above. The examination periods are set in bold and the tolerances are described in parenthesis. The alternative tolerance configuration is optional and is not always configured.
Example: PreOP (-2 months/0 months | alternative: -12 months/0 months). In this example, the study period for the preOP time point begins 2 months before surgery and extends to the day of surgery (0 months). The alternative tolerance, on the other hand, starts 12 months before the date of surgery and also extends to the day of surgery.
This table can be filtered using the “Search” tool on the upper right corner (Figure 2).

Downloading single images
Images that are already in the database can be downloaded by clicking on the Image information and download-icon (Figure 2) of each cell.
Downloading the table
This table can be downloaded as an Excel-file. To do this, the buttons “Export” and subsequently “Excel” need to be clicked in the upper right corner.
Updated on 13 Sep 2023
